First Exercise
|
|
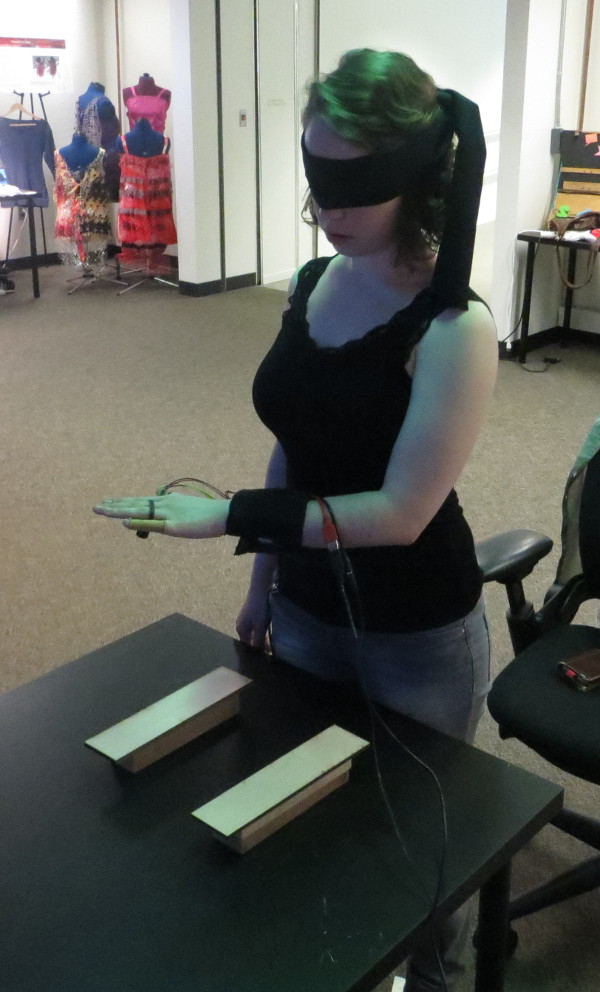
During the first exercise the subject was to wear a blind fold and asked to
identify how many objects were place on the table.
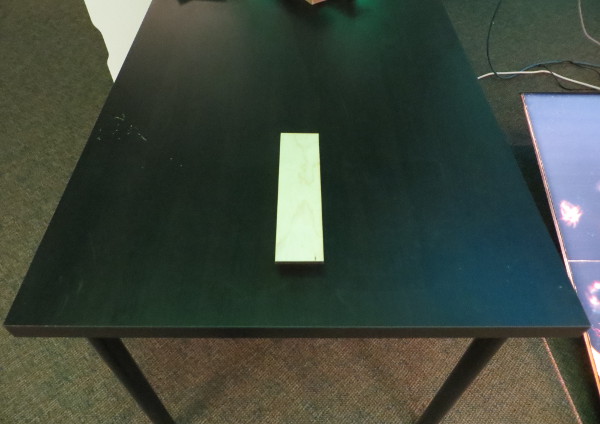
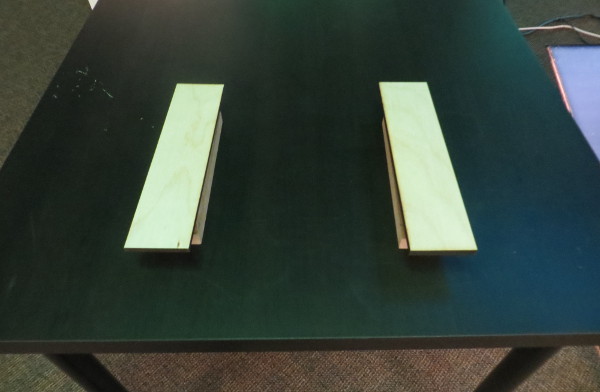
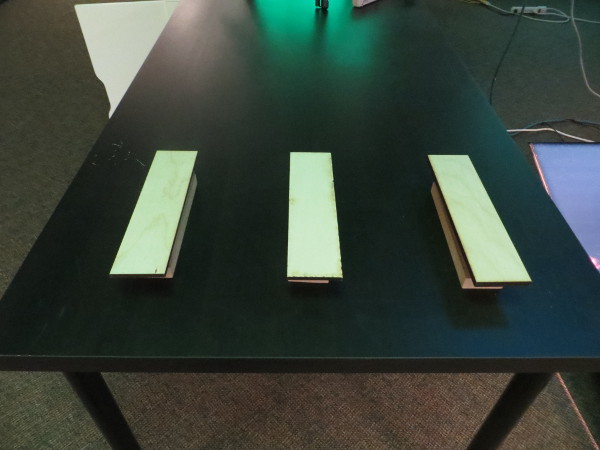
The objects were long thin rectangles placed perpendicular to the edge of the table
where the subject was positioned. This way, the subject was able to
concentrate only on a lateral movement.
The number of objects was randomized between 0 and 3.
This exercise was repeated 4 times. Twice with objects at 2" from the table and
twice with objects at 1" from the table.
The level of sensitivity was also changed, twice at level 10 and twice at level 5.
This sensitivity dial simply changes the mapping between the sensor data and the frequency
range of the transducer. At 10 (low sensitivity) small differences are harder to detect
but there is less noise. At 5 (high sensitivity) the small differences are more noticeable
but so is the noise.
|
|
Percentage of correct Answers of 1st Exercise
|
|
|
Sensitivity 10
|
Sensitivity 5
|
|
Two Inch
|
0.47
|
0.41
|
|
One Inch
|
0.65
|
0.53
|
|
Overall
|
0.51
|
|
|
Discussion
The subjects had no experience except for using the device for 5 to 10 minutes before the
start of the test.
Initially the idea was to have the user control the sensitivity level according to what they felt
but this turned out to be complicated since the users had no experience with artificial sensing
or with this specific sensory feedback loop. This is why I decided to tweak the test and control
the sensitivity.
I expected to see a clear advantage of Sensitivity 5 over Sensitivity 10 since 5 would give a larger
frequency jump for a smaller change sensed by the proximity sensor. But to my surprise, it
was sensitivity 10 the one with the advantage and reported preference by subjects. Mostly due
to the stability of the signal.
The results do not show an overwhelming success rate but I believe that this was a "warm up"
exercise and it mostly helped the users get a better grip of the sensory experience for the following
exercises.
|
Second Exercise
|
|
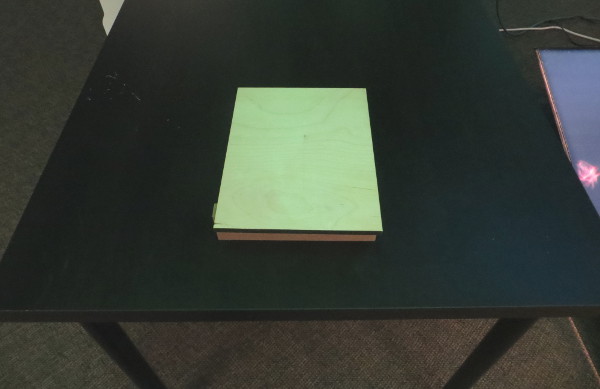
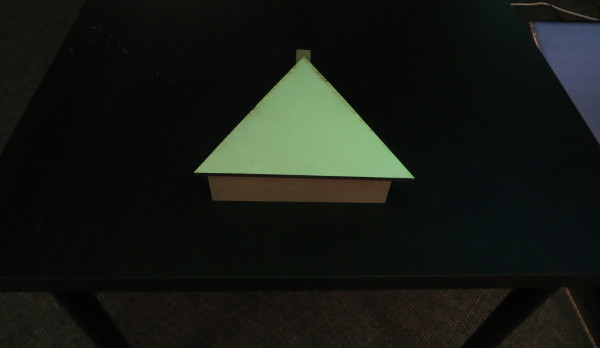
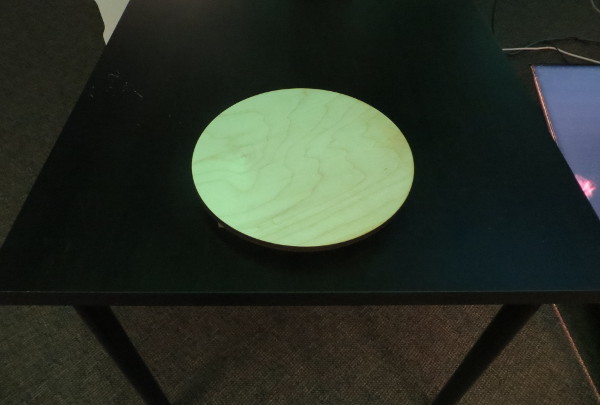
During the second exercise the subject was asked to identify the shape of an
object placed in front of them.
The objects were one of three. A circle, a rectangle or a triangle. The shape
was chosen at random.
This exercise was repeated 4 times. Twice with objects at sensitivity 10 and
twice at sensitivity 5.
The subject was allowed to see the objects and see how they were going to be
positioned on the table. This was so that the subject would not spend too much
time trying to find it. This exercise required the subject to scan the space
in 2 dimensions.
|
|
Percentage of correct Answers of 2nd Exercise
|
|
|
Sensitivity 10
|
Sensitivity 5
|
|
Circle
|
0.52
|
0.67
|
|
Rectangle
|
0.40
|
0.29
|
|
Triangle
|
0.67
|
0.80
|
|
Overall
|
0.54
|
|
|
Discussion
For this exercise, the user had a better sense of what the experience felt like. So there was
always some confidence going in. From the first exercise, the detection of an edge was understood
so the users would have in general two strategies.
Either find an edge and follow it in two dimensions and see what shape they would draw with their arm,
or use a scanning lateral motion and try to compare how long the object was from edge to edge. The
rectangle did worse than the others because users were quicker to say Circle or Triangle just because
the sensation was new and different than expected. It was clear that many times the user would make
a choice early and then any subsequent information from the sensor was "shoe-horned" to fit this mental
model.
|
Third Exercise
|
|
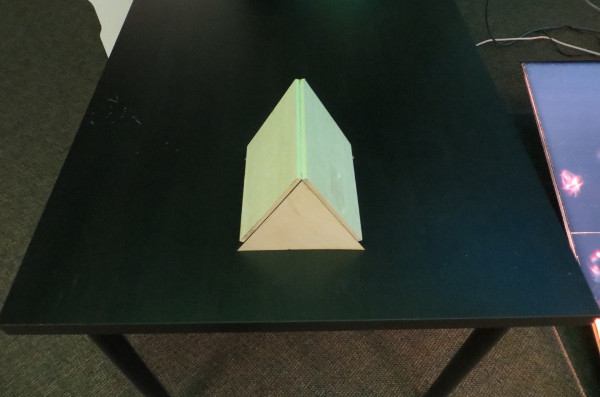
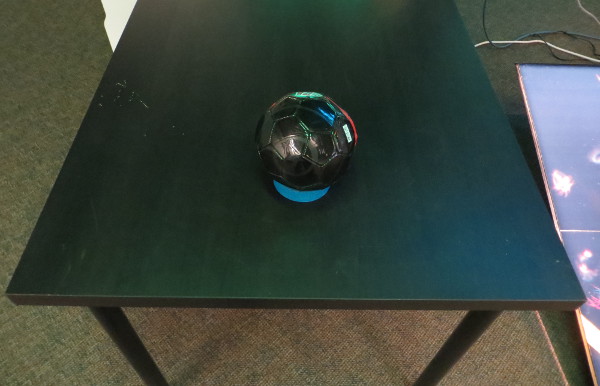
During the third exercise the subject was asked to identify the shape of an
object placed in front of them.
The objects were one of three. A sphere, a cube or a prism. The shape
was chosen at random. (The cube object was the same as the square but at 3"
from the table).
This exercise was repeated 4 times. Twice with objects at sensitivity 10 and
twice at sensitivity 5.
The subject was allowed to see the objects and see how they were going to be
positioned on the table. This was so that the subject would not spend too much
time trying to find it. This exercise required the subject to scan the space
in 3 dimensions.
|
|
Percentage of correct Answers of 3rd Exercise
|
|
|
Sensitivity 10
|
Sensitivity 5
|
|
Sphere
|
0.33
|
0.40
|
|
Cube
|
0.56
|
0.67
|
|
Prism
|
0.82
|
0.45
|
|
Overall
|
0.55
|
|
|
Discussion
This was a challenging exercise because the users had an understanding of how the sensory feedback
worked and what the new objects should feel like. The truth was that the sphere and the prism had a
very different signal than we thought. Both would ramp up the frequency as the users would expect but
once on the apex, the sensor would overload and give a very low frequency. This explains the cube
doing better than the sphere. The prism did better than all because the user would pick it with any strange
new behaviour but mostly because once the subjects learned to map the very peculiar signature to the
prism it was very easy to identify.
|
Total Percentage of Correct Answers
|
|
Percentage of correct answers across the three exercises.
|
Percentage of correct Answers through all exercises
|
|
|
Sensitivity 10
|
Sensitivity 5
|
|
Average
|
0.54
|
0.52
|
|
Overall
|
0.53
|
|
|
Discussion
Overall the users had a success rate of near 50%. I believe that this result is encouraging given the fact
that they had no previous experience with sensory substitution devices and that the practice time with
the device was very limited. I would expect that with a bit of training the results would jump significantly.
Specially if the users get used to the specific signatures the objects give.
|
Dominant V.S. Non-Dominant Hand
|
|
The hand in which the sensing device was located was also randomized
to see if there would be any advantage to using the dominant hand to
control an artificial sense.
|
Percentage of correct Answers depending on hand used
|
|
|
Dominant
|
Non-Dominant
|
|
Average
|
0.46
|
0.53
|
|
|
Discussion
The data shows that there is an advantage of non-dominant hand use but I'm not sure why this happens
or what it means
|
Time taken to Guess
|
|
The subjects were given an initial 2 minutes to venture an answer if they felt confident. If not, the subject
was given 2 more minutes. After a total of 4 minutes the system would be shut down and they had to
give their best guess.
|
Percentage of correct Answers depending on time
|
|
|
Less than 2 min.
|
between 2 and 4 min.
|
|
Average
|
0.55
|
0.44
|
|
|
Discussion
There is an advantage to the decision taken in the first 2 minutes.
I found that the first "guess" tended to be correct but when the
subject was not confident and would try to corroborate with more
pases, they would feel confused.
Many times they reported knowing the right answer but then changing
their answer when exploring for a longer time.
|